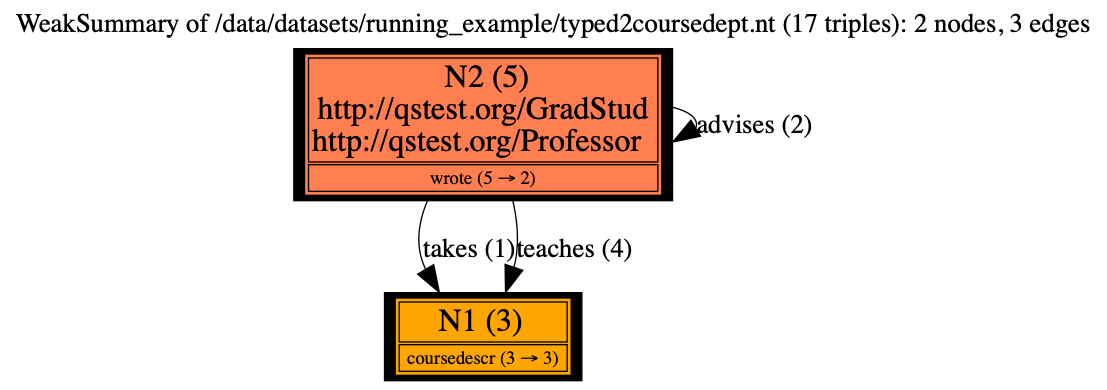
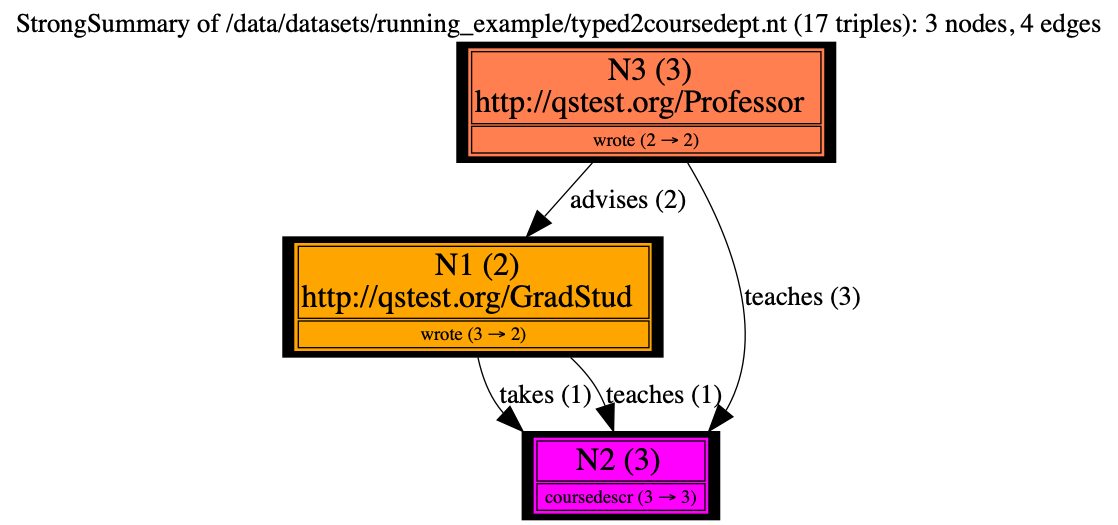
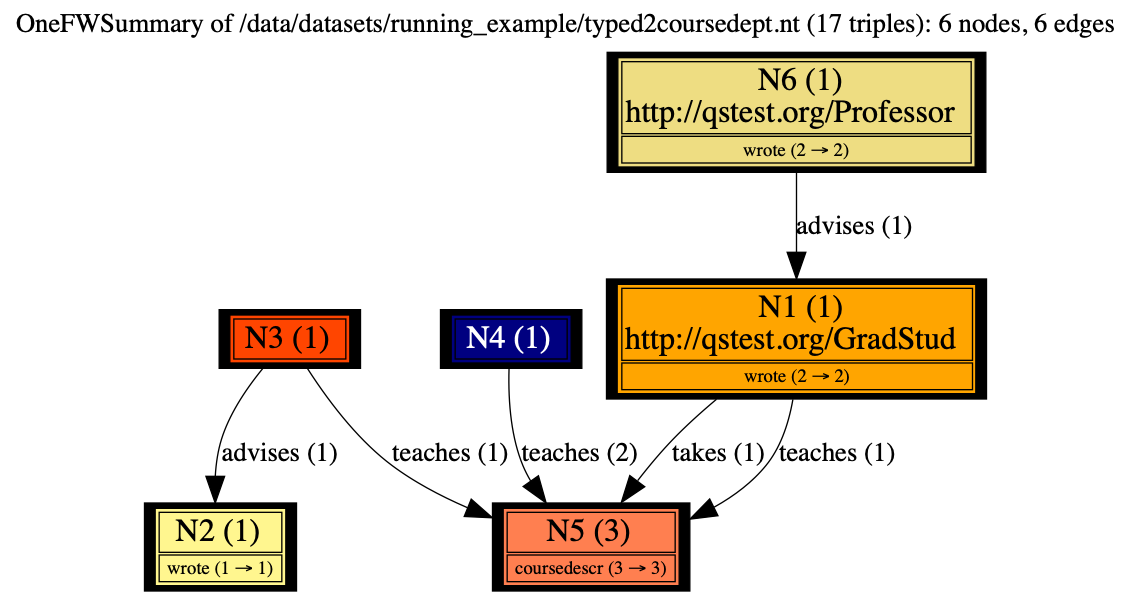
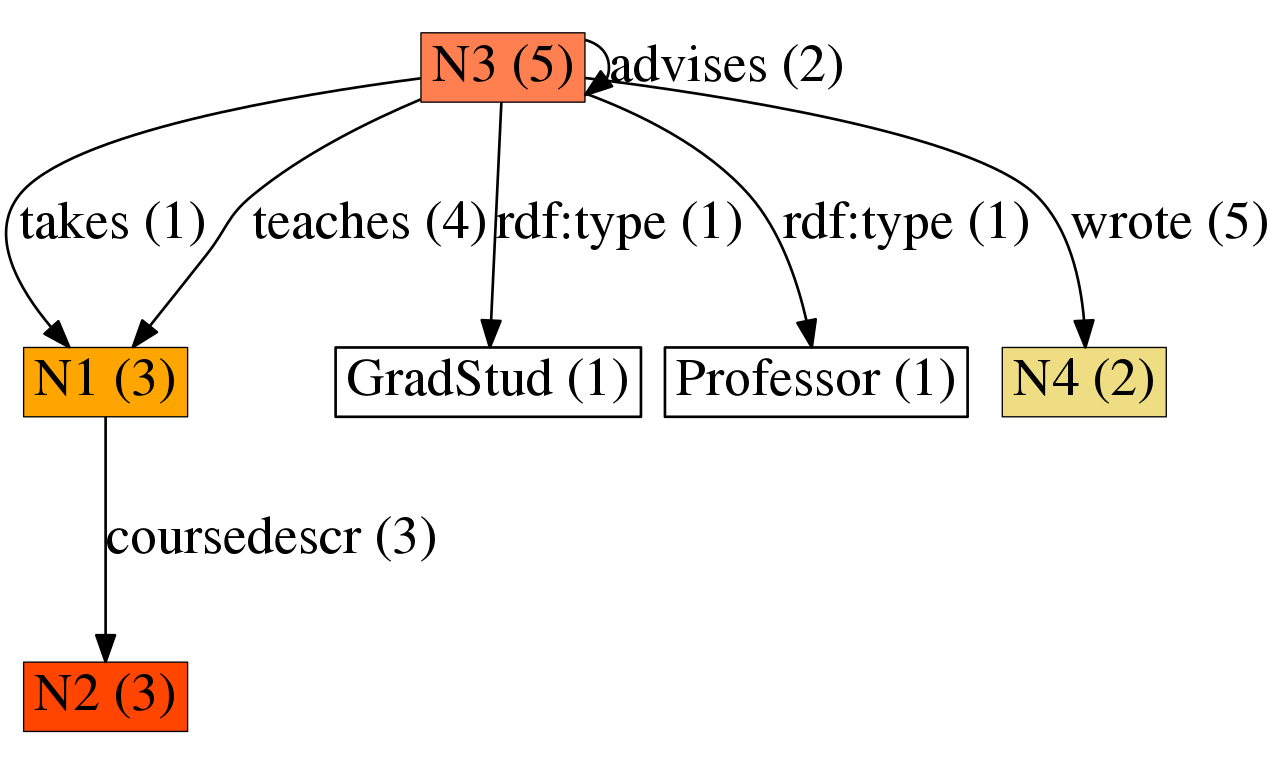
Gallery of a small dataset “2course-department” used as a running example in our paper. This graph is so small that we can visualize summaries as they are, in a plain drawing:

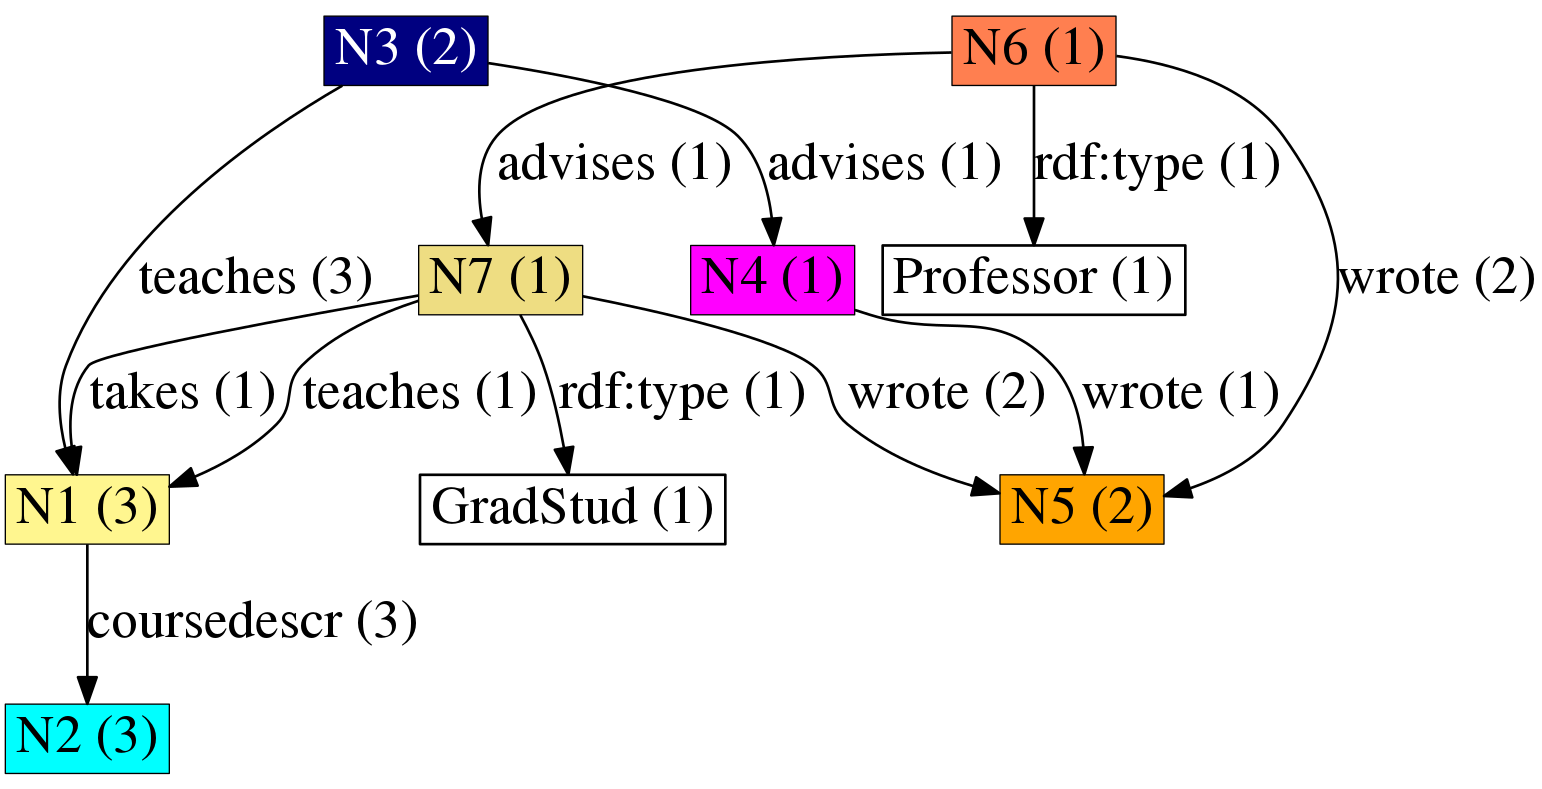

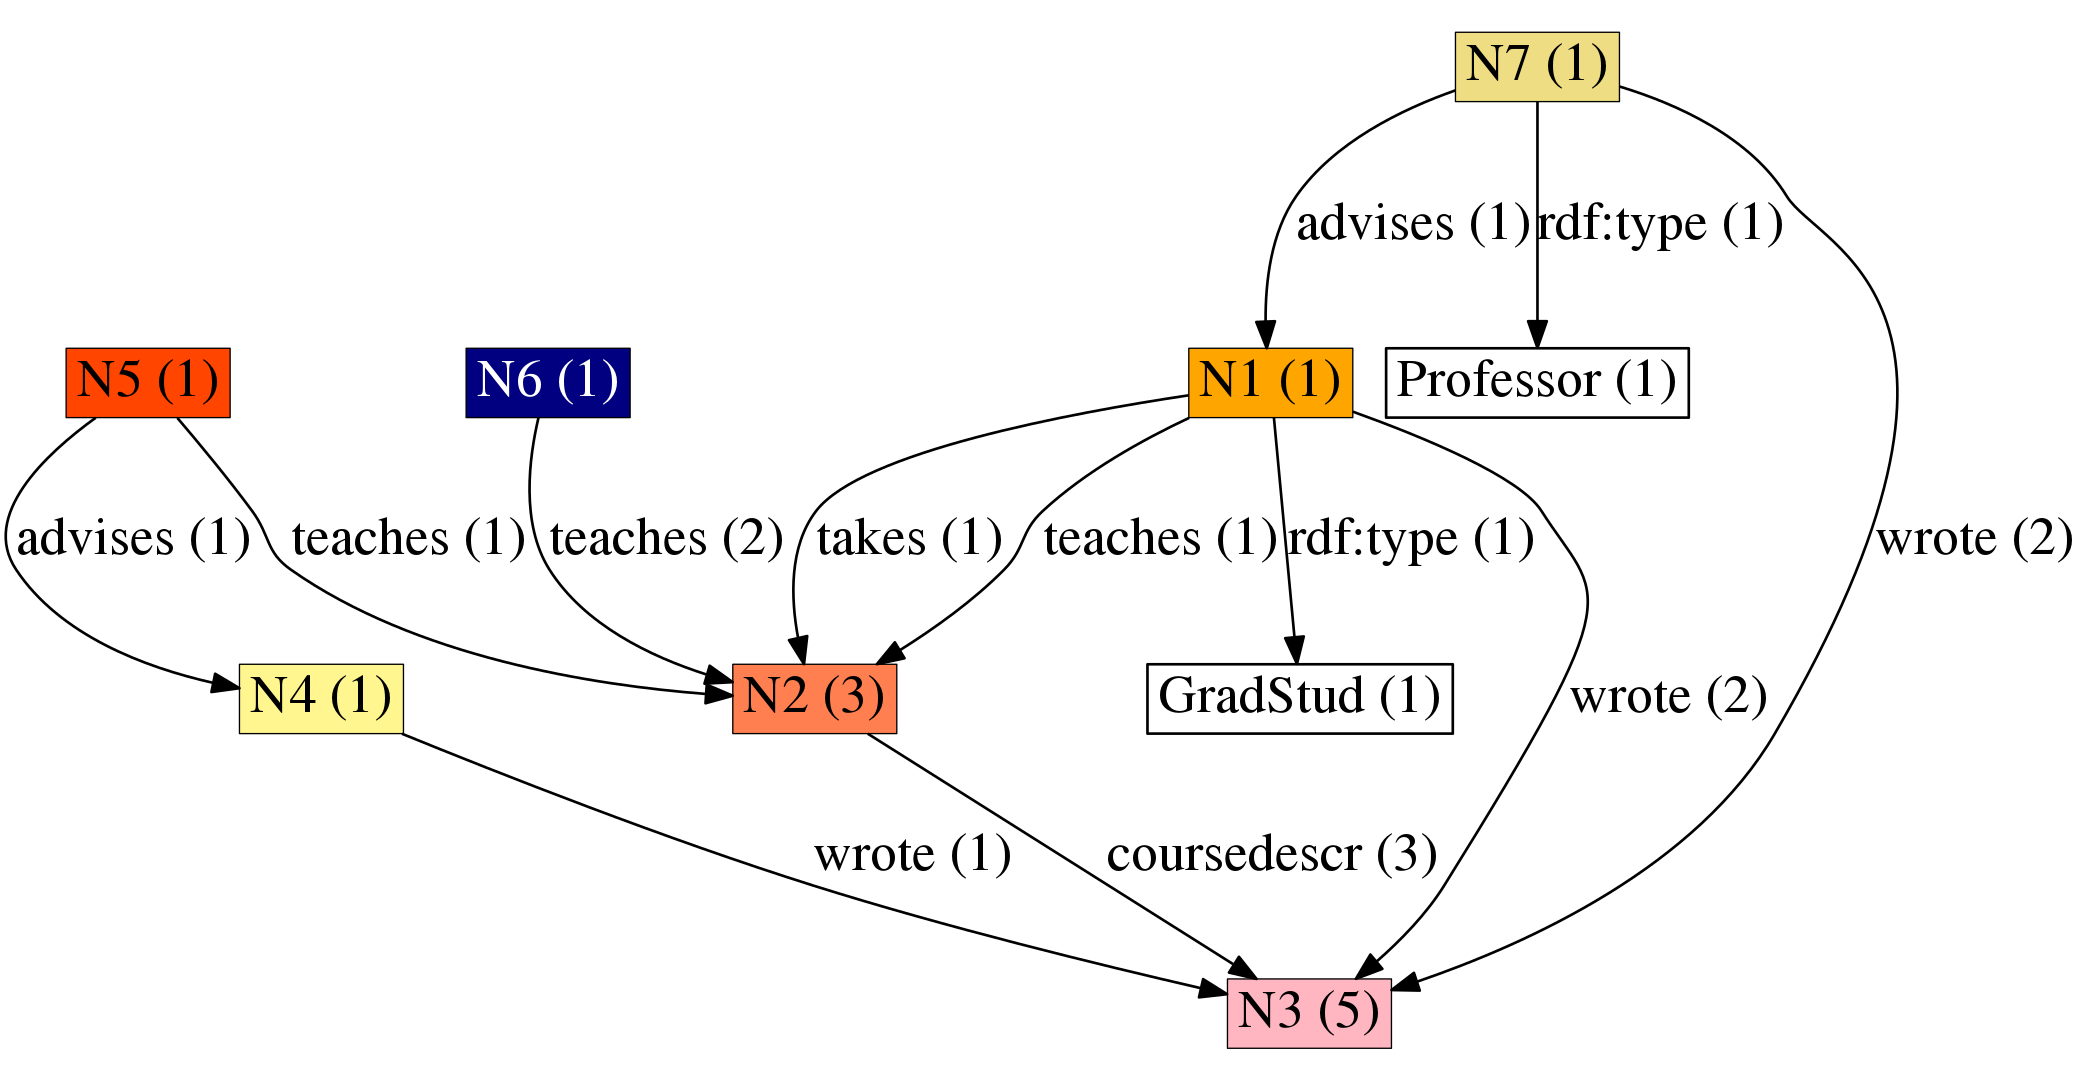
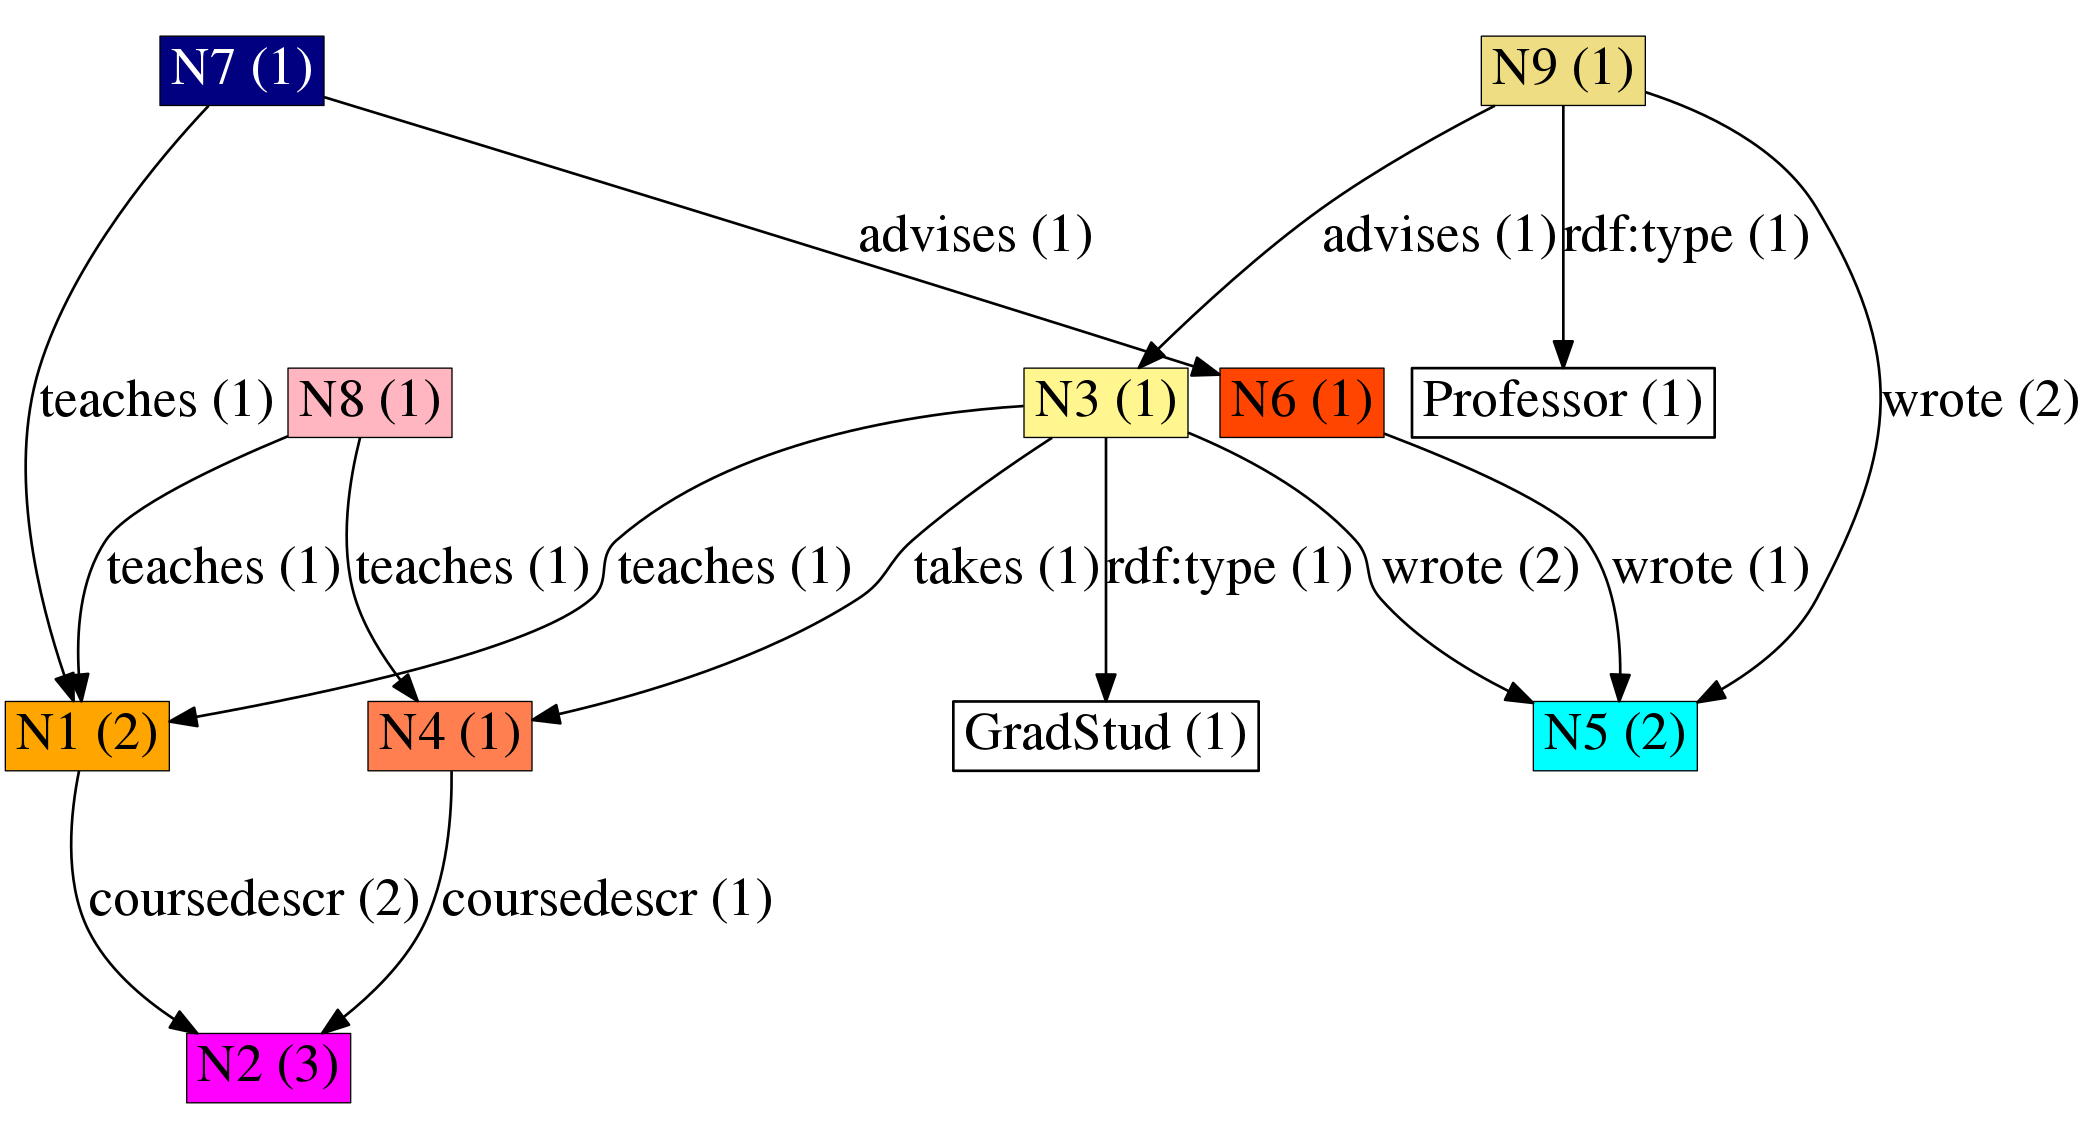
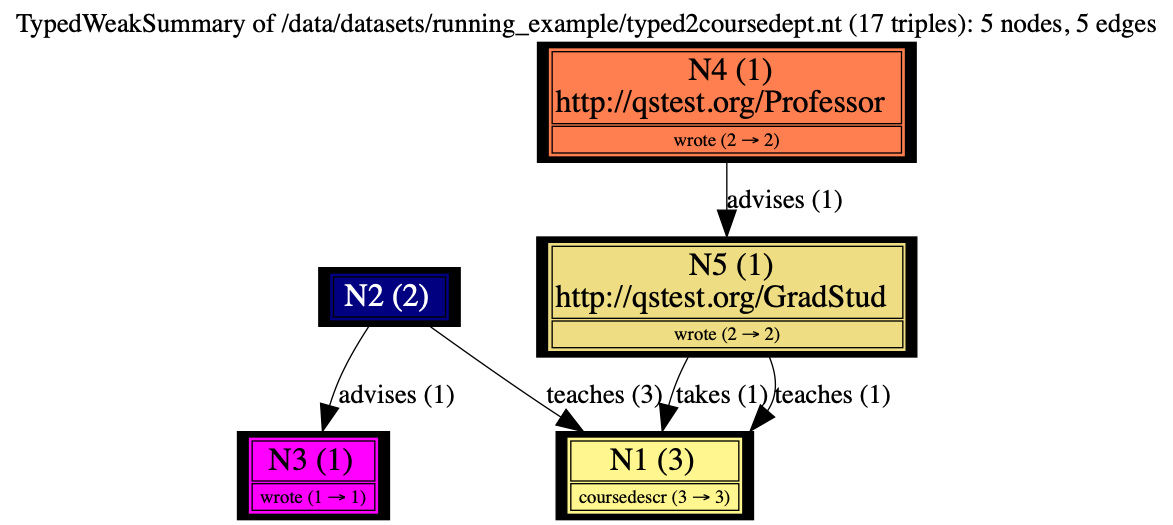
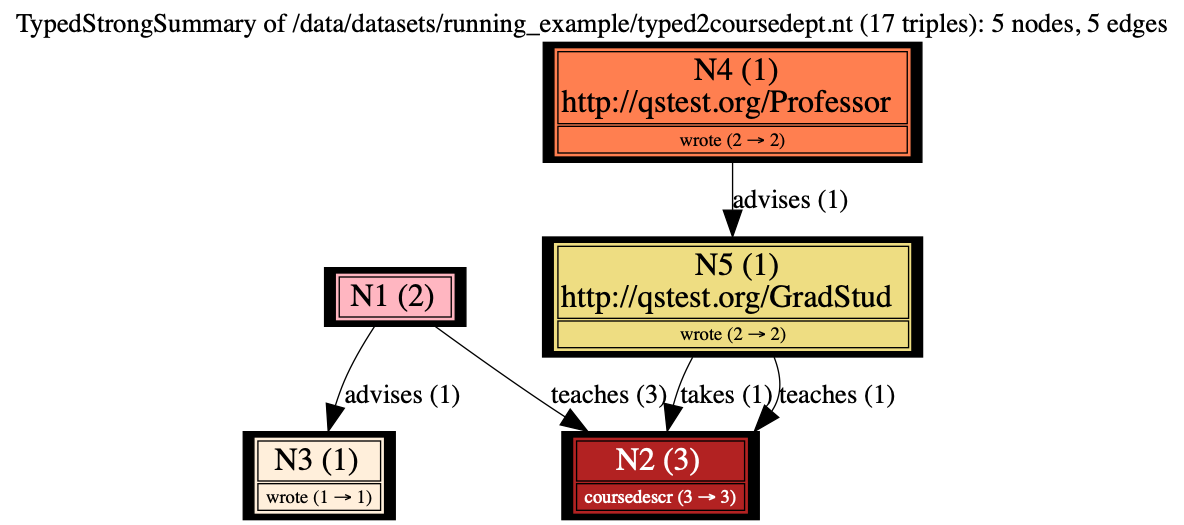
They can also be viewed using our visualization inlining types and leaves to their parents: