


Below we show the Weak, Strong, Typed Weak, Typed Strong, 1-forward and 1-forward-and-backward bisimulation summaries of a 1 million triples LUBM benchmark (saturated) graph.

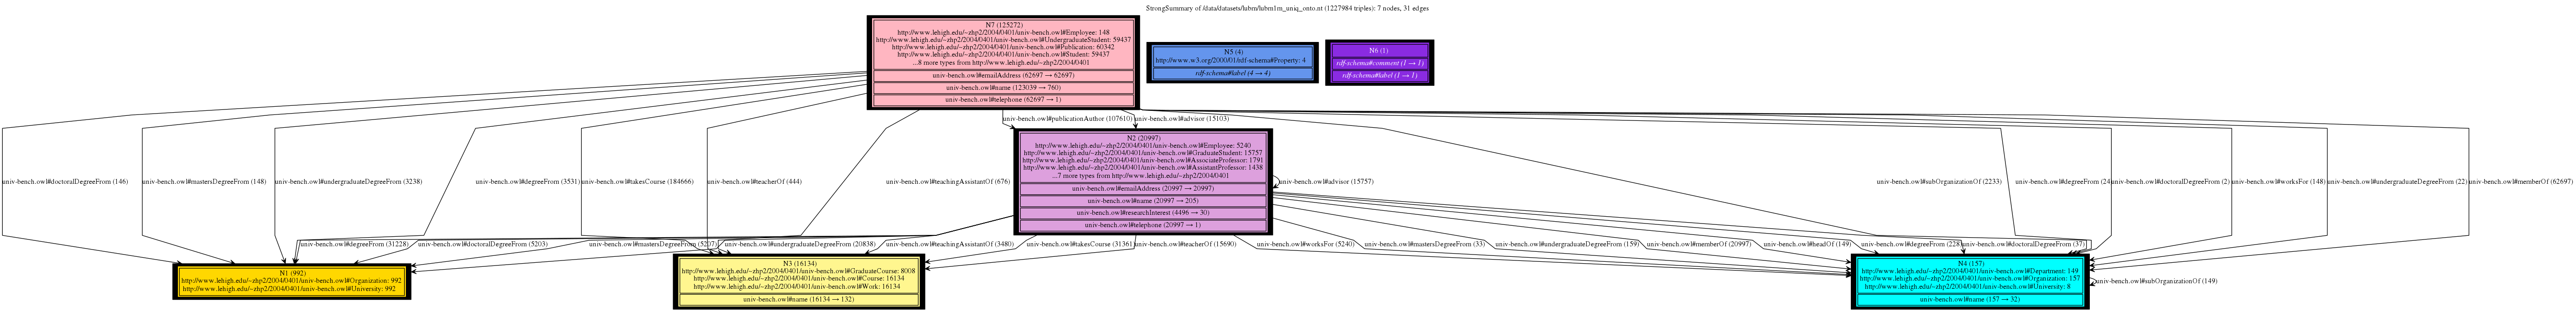
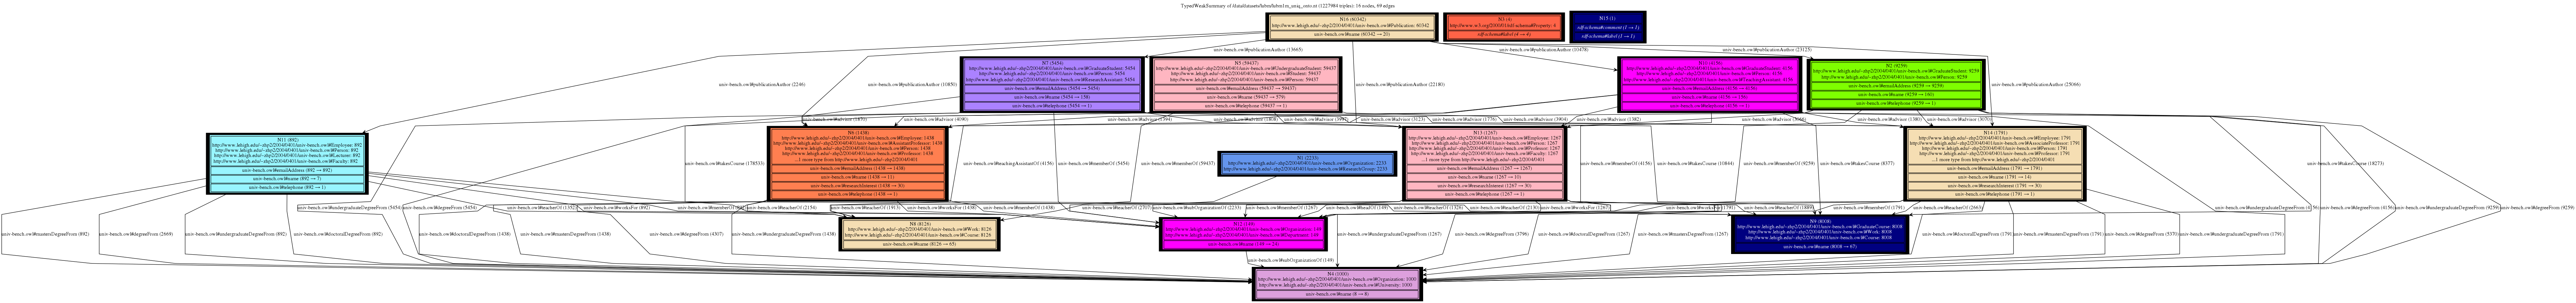


We can see that Weak summary is very compact. On the other hand, slightly larger Strong summary remains very informative and resembles E-R diagram. Typed summaries give an insight about the dataset structure as it was designed according to the benchmark. Finally, bisimulation summaries are much bigger and don’t give a meaningful picture of the data.