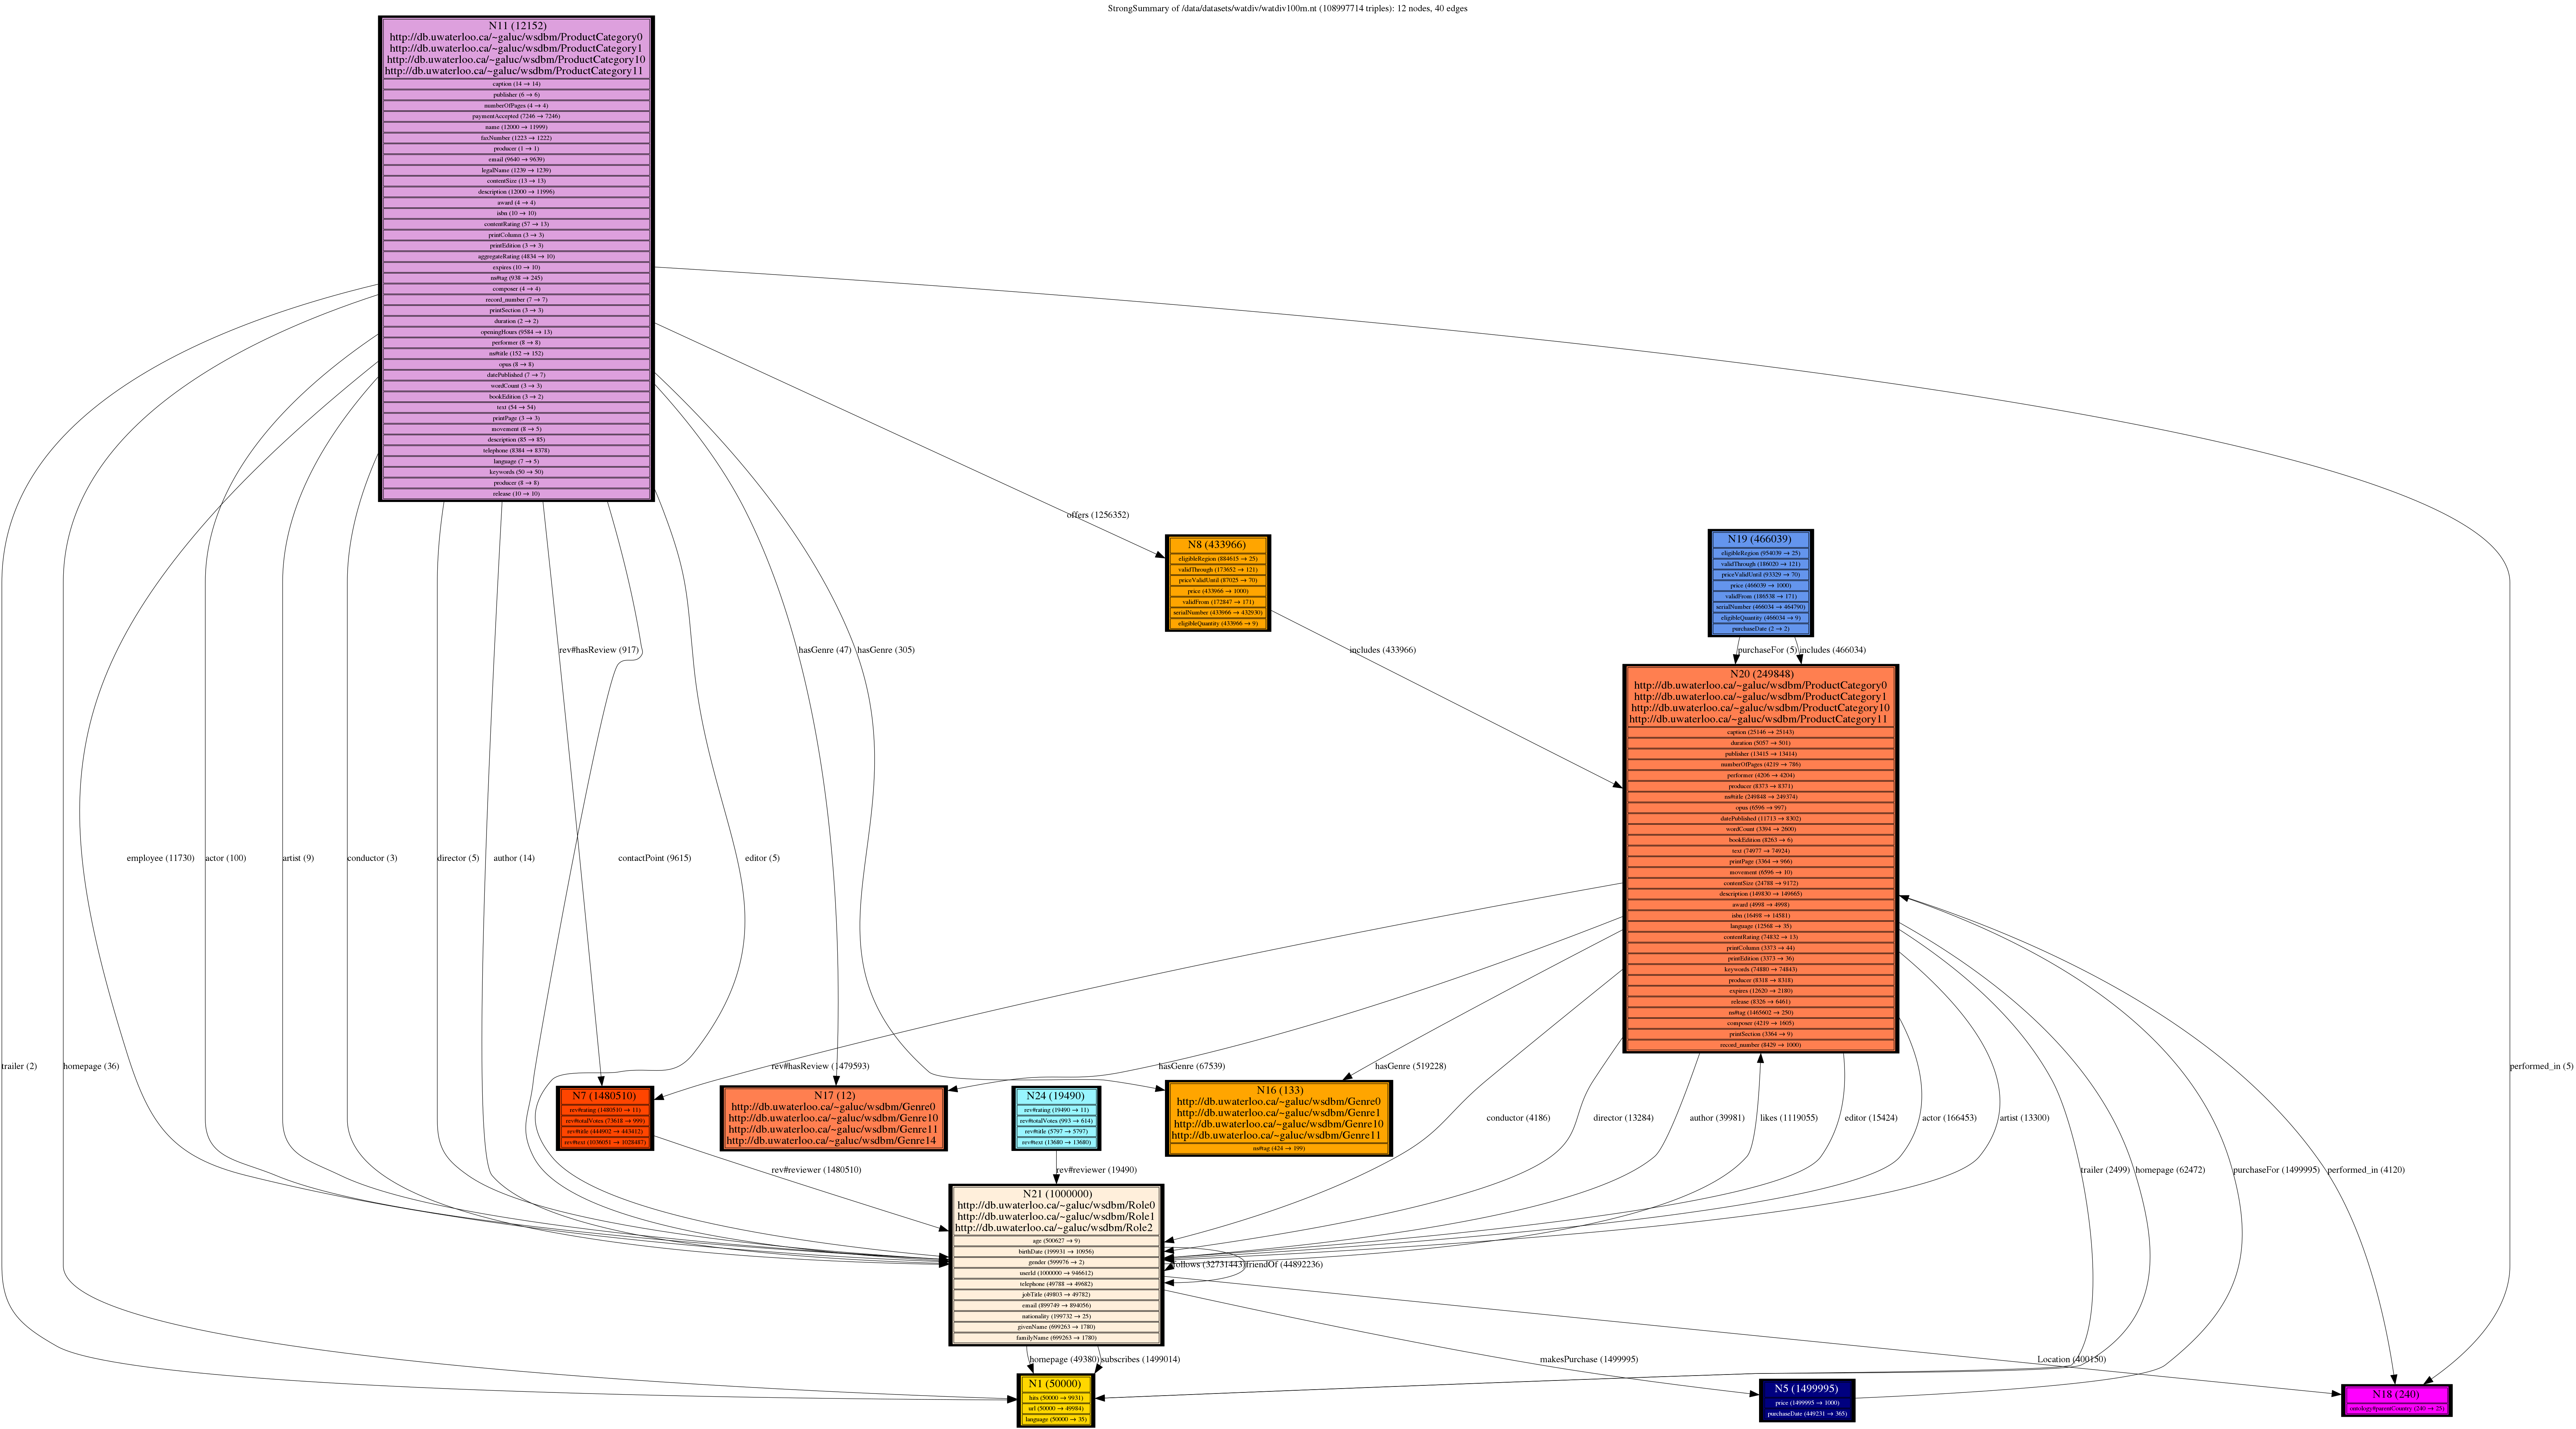
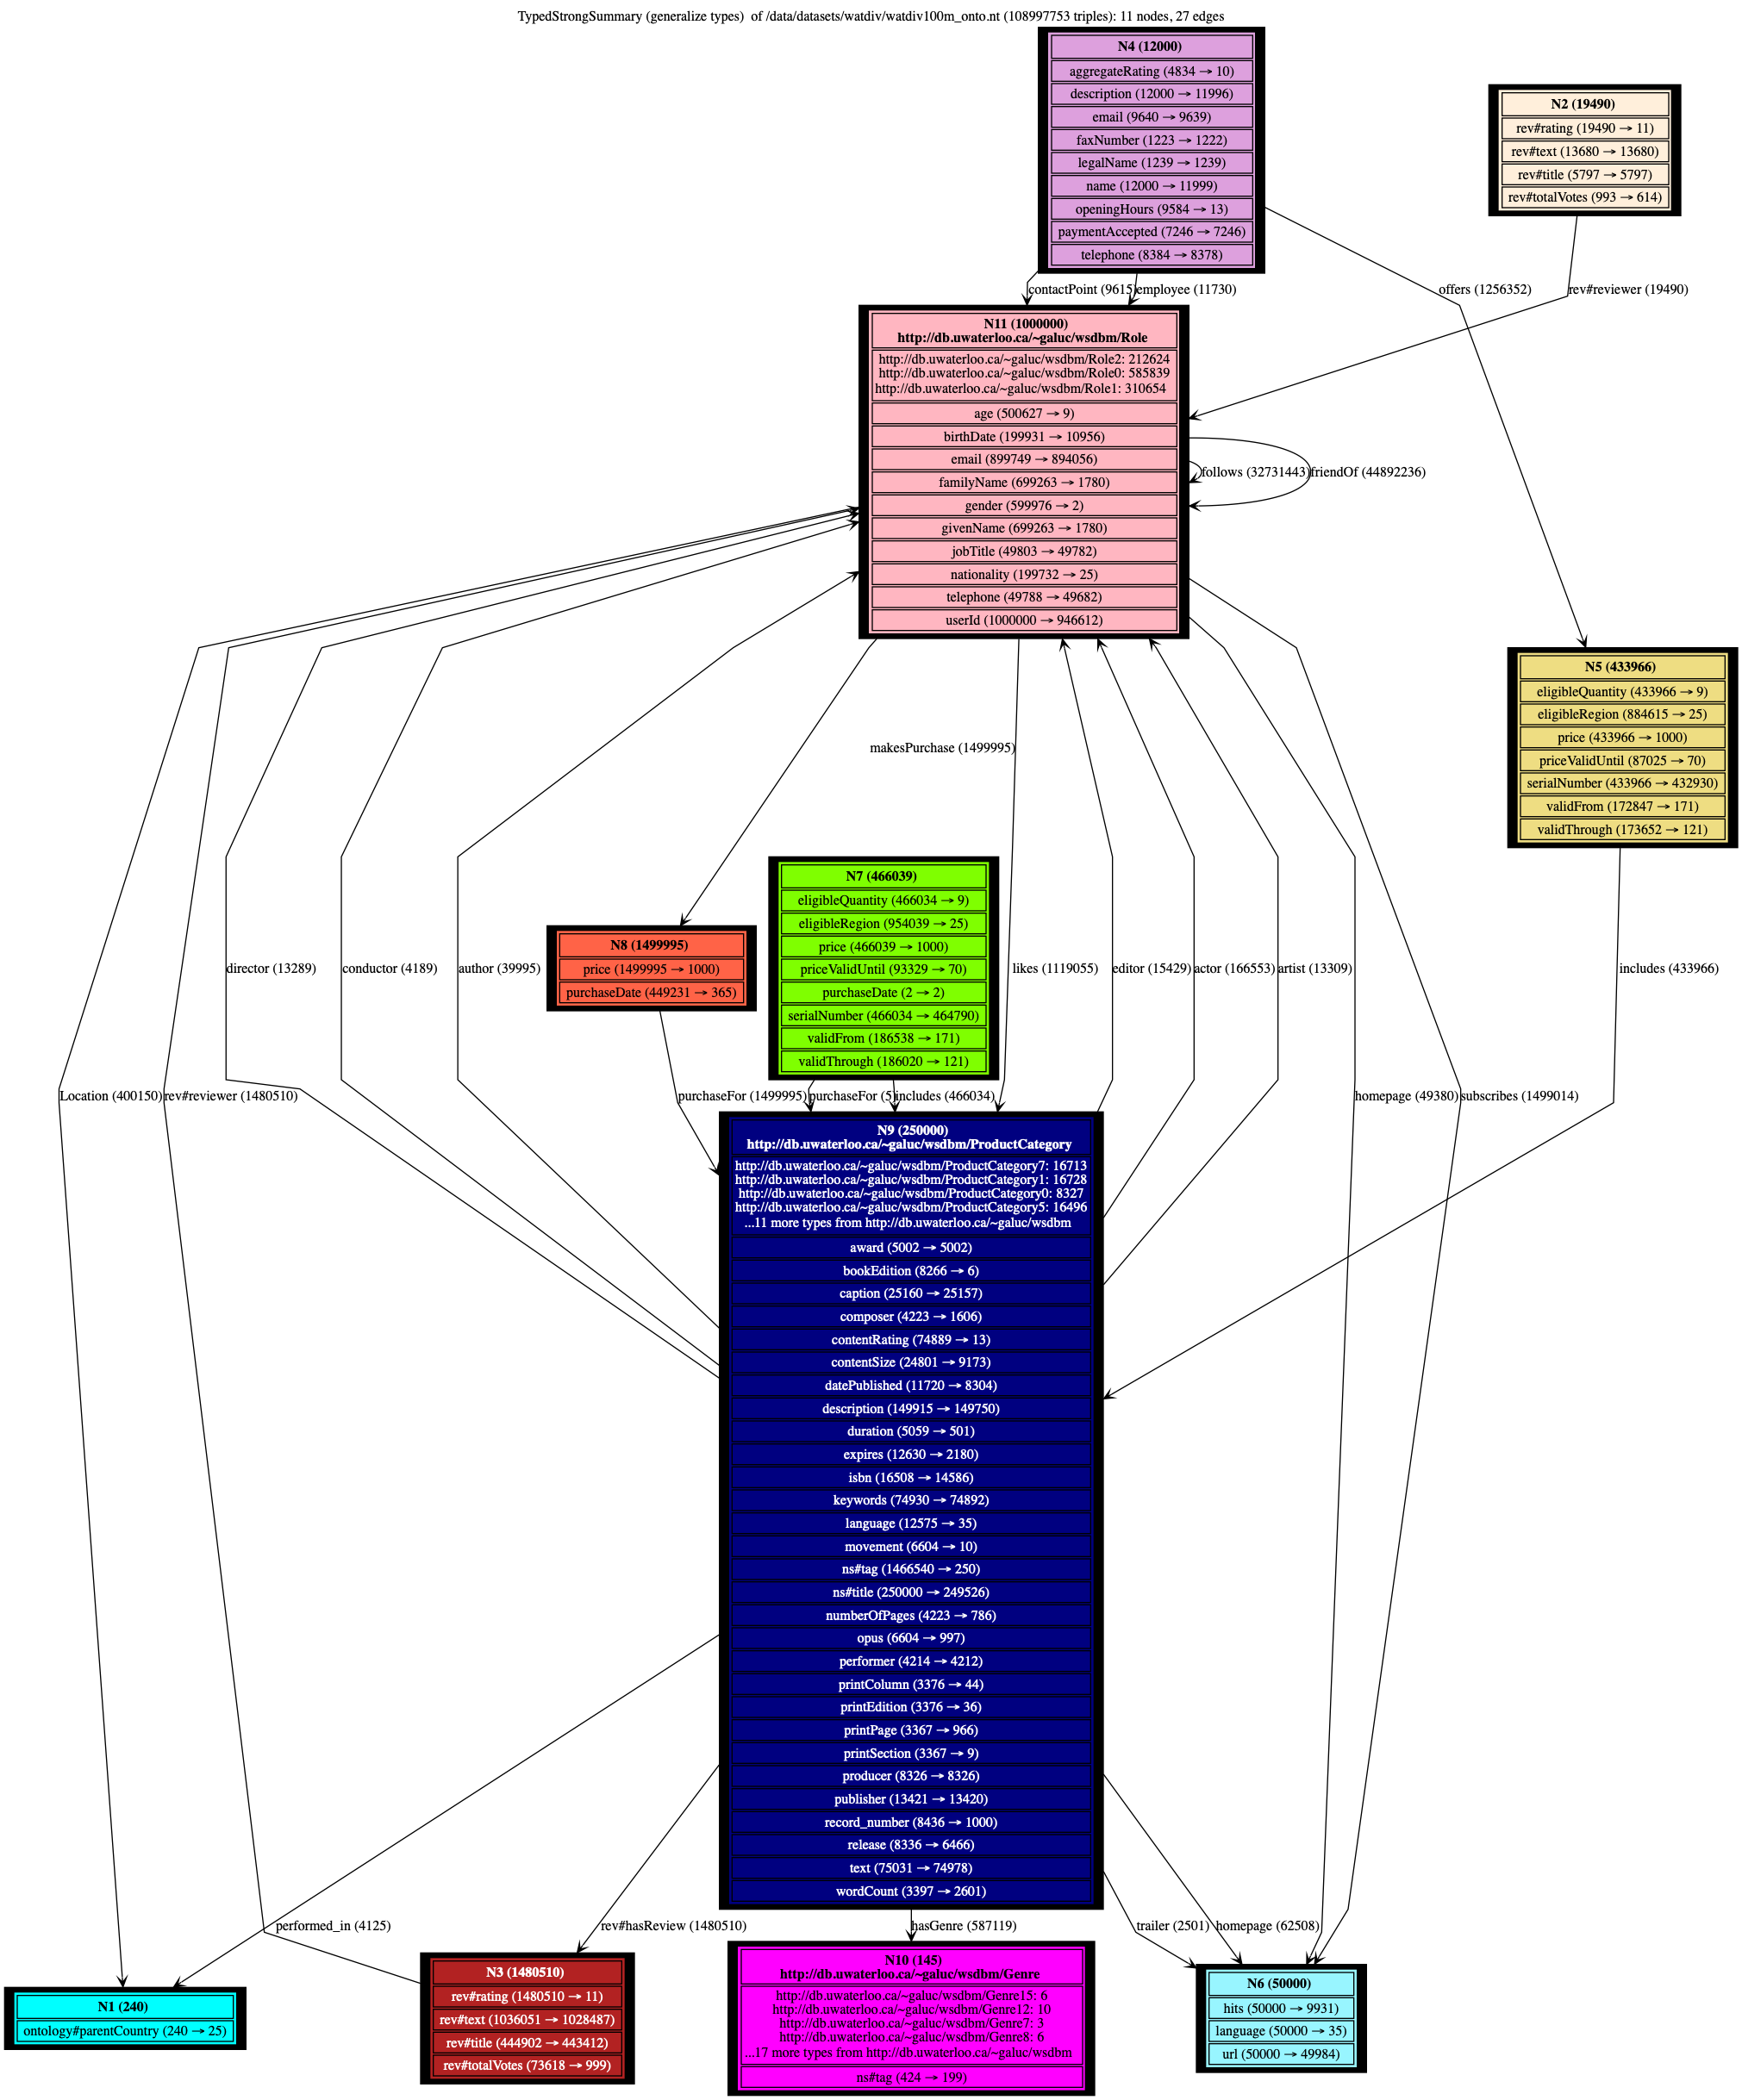
This is a gallery of watdiv100m dataset showing Weak and Strong summaries. The Weak summary in this example looks more convincing and understandable whereas the Strong distinguishes many more node classes which may lead to a better understanding of the data. The two last summaries: Typed Strong and Typed Weak are obtained using type generalization technique and explore interesting trade-offs between the compactness of summary and representativeness of the nodes thanks to the types.